
The following dashboard provides insights into sales, margins, volumes, and conversions, with focused views on product performance and regional data.
Objective: The goal is to get an at-a-glance view of key metrics and track how a business or project is performing in real-time through an interactive dashboard.
Result: Using this dashboard, users can make data-driven decisions, apply filters, and gain insights from various charts that show progress and trends.
Project Duration: Development typically takes 2 weeks to 2 months, divided into design and data collection phases, before building and deploying the dashboard.
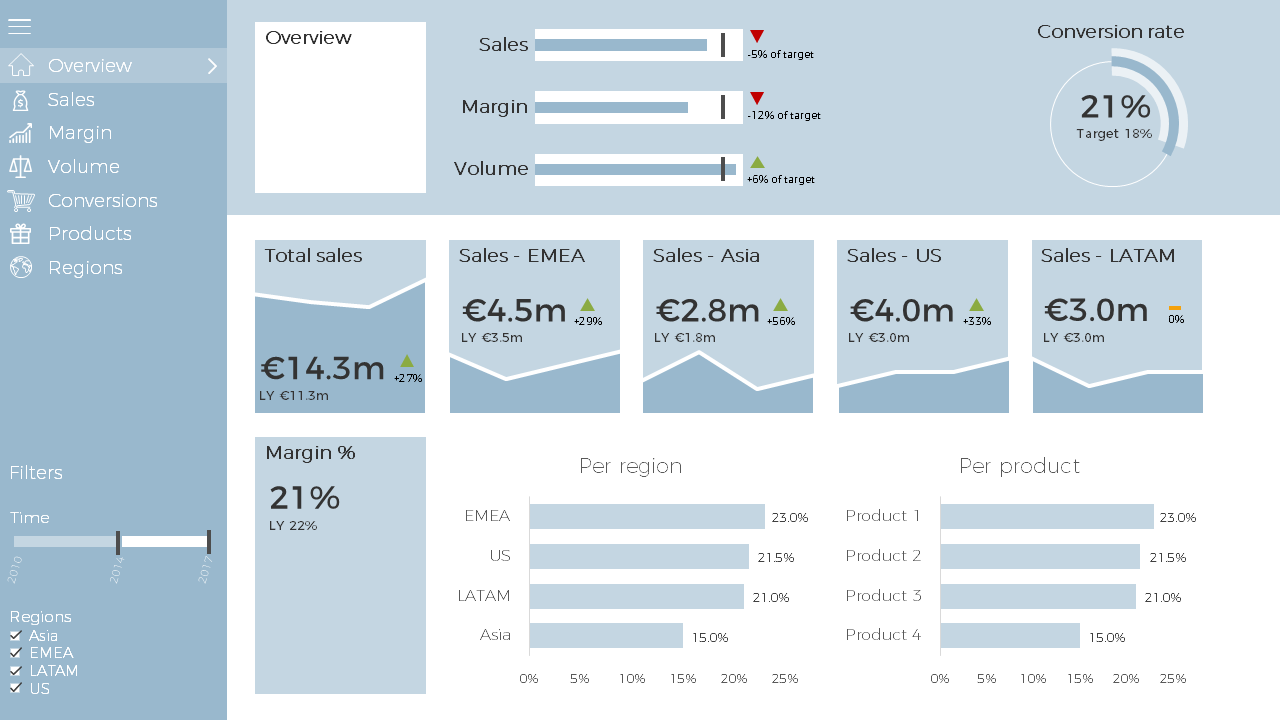
This dashboard section provides an overview of total sales, trends, and performance across different regions and products.
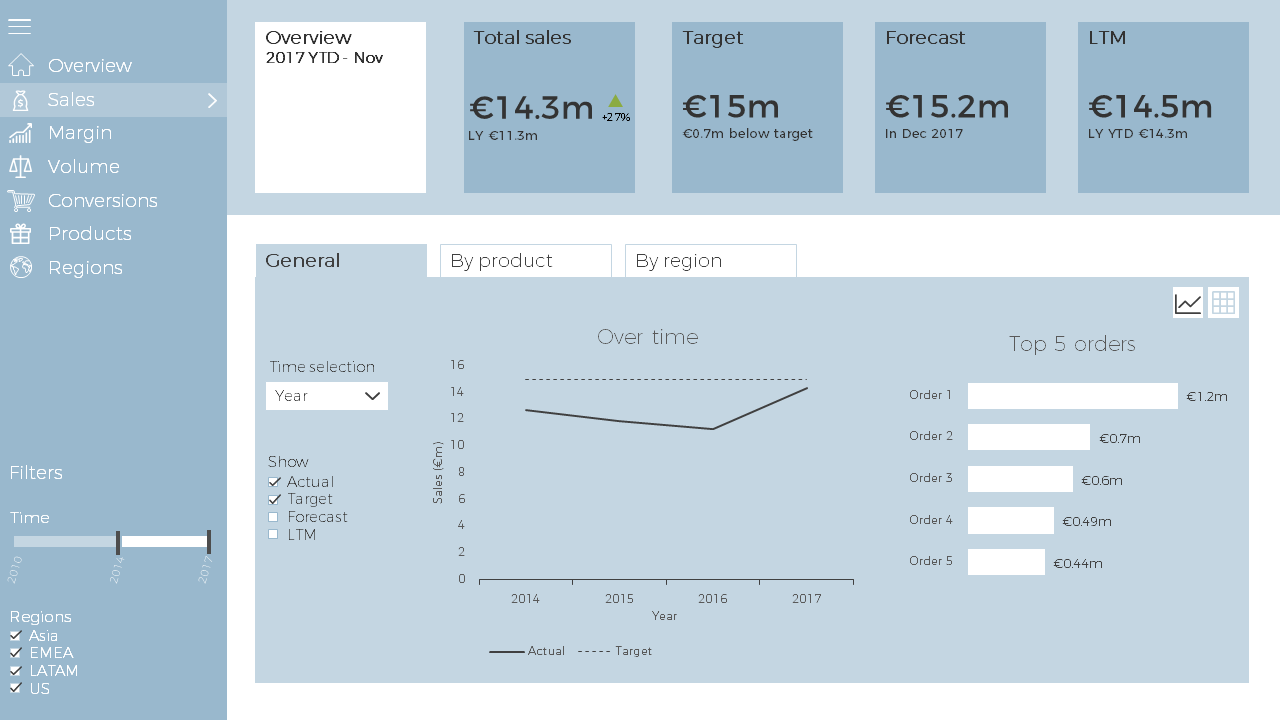
Margins analysis helps track profitability and identify areas where cost savings can be achieved across products and services.